Underwater Gliders
In a visionary article, Henry Stommel (1989) suggested that small autonomous buoyancy-driven vehicles could roam the global ocean returning observations of its changing state. Like the profiling floats of the Argo program, these vehicles would change their volume in order to alternately float upward and sink downward through the ocean, all the time gliding forward. Stommel imagined that some mechanism similar to one he developed with Doug Webb would be used to allow the ocean's temperature gradient to provide the energy for buoyancy changes. With remarkable prescience, Stommel predicted the size and performance of today's underwater gliders except that the dream of thermal power has remained elusive.
Today's underwater gliders (Davis et al., 2002) are autonomous underwater vehicles that use battery powered hydraulic pumps to vary their volume by a few hundred cubic centimeters in order to generate the buoyancy changes that power their forward gliding. At the surface, GPS is used to locate the vehicle and satellite data relay is used to send this location and other data to shore while allowing operators to send back changes to the glider mission. Depth capabilities range from 200 m to 1500 m while operating lifetimes range from a few weeks to several months. These long durations are possible because the gliders move very slowly, typically 25 cm/s or 0.5 knots.
What is SPRAY?
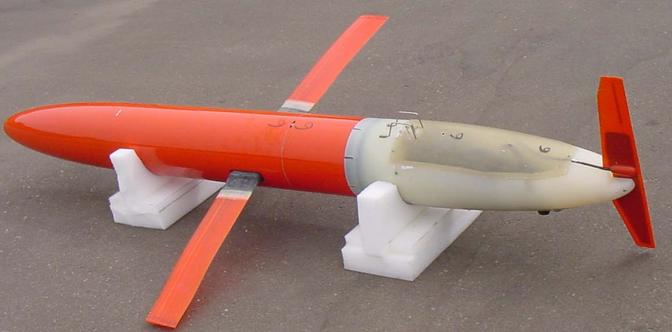
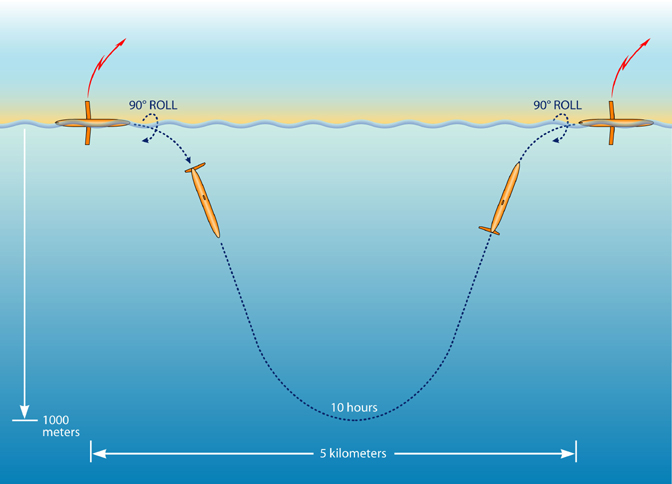
'Spray,' shown above, is an underwater glider developed under ONR support by Scripps and Woods Hole scientists (Sherman et al., 2001) to provide a small long-range autonomous platform for long-term ocean measurements. 'Spray' uses primary-lithium-battery power and a hydraulic pump to periodically change its volume to alternately glide upwards and downwards. This results in a see-saw path at descent/ascent angles of 18-25 degrees and forward speeds of 25-35 cm/s. Heading and ascent/descent rate are controlled without control surfaces by moving weight (battery packs) inside the hull to change roll and pitch, much as a hang glider is controlled. As shown below, at the surface Spray rolls 90o to raise one of its wings, each of which contains a combined GPS/Iridium antenna. Using the wings to house antennas eliminates the drag associated with separate antenna housings and allows redundant systems so that communication and navigation can continue even if one antenna is damaged, as happened when one Spray was run over by a surface vessel.
Specifications
The following table describes typical performance in operations to 1000 m depth. The speed figures have been field verified. The duration and range estimates are calculations based on measured energy use and battery capacity at cold operating temperatures.
|
A 19 degree glide angle maximizes distance travelled per unit energy for fixed buoyancy A 25 degree glide angle maximizes horizontal speed per unit buoyant forcing. Range is extended roughly as 1/speed2. | ||||||||||||||
Vital statistics for Spray are given in the following table:
| Length, Diameter | 200cm, 20cm |
| Wingspan, Chord | 110cm, 10cm |
| Mass, Payload | 51.8kg, 3.5kg |
| Energy | 13 MJ from 52 DD Li CSC cells (12 kg) Refueling cost ~ $3000 |
| Buoyancy Control Efficiency | Motor and Reciprocating Hydraulic Pump 50% at 1000 dbar, 20% at 100 dbar |
| Maximum Depth | 1500m |
| GPS Navigation | +/- 100m |
| Iridium Satellite Link | Two-way, ~ 100 bytes/sec, 40 J for first KByte, 30 J for each extra Byte |
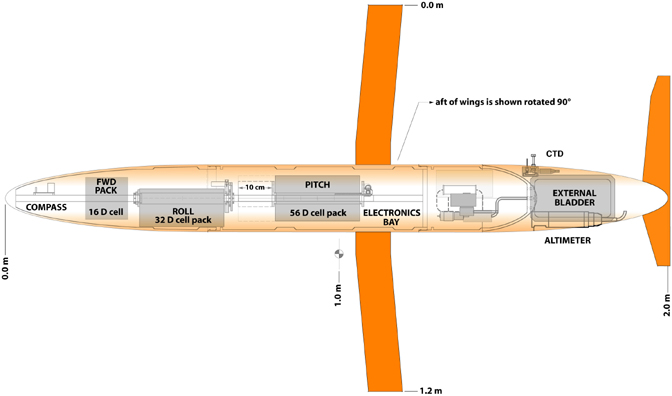
The main components of Spray are shown schematically above. The 6061 aluminum pressure case is made in three pieces and houses batteries, hydraulic system, compass, attitude sensor, GPS receiver, Iridium transceiver, and the microprocessor controller. An aft flooded bay houses the external bladders that expand to increase buoyancy. This bay also houses the sensor suite selected for each mission. Sensors that have been used include: Precision Measurement Engineering CTD; modified Sea Bird 41 CP CTD with seawater pump; Sea Point Optical Backscatter Sensor; Sea Point Chlorophyll Fluorometer; Tritech PA200 acoustic altimeter for bottom avoidance; and Sontek Argonaut-SGP 750-kHz Acoustic Doppler Current Profiler.
In addition to the sensors above, Spray measures the horizontal current averaged over its operating depth. The measured (from pressure) vertical velocity and a field- and laboratory-verified model of gliding dynamics are used to infer the glider velocity through the water (this assumes the vertical ocean velocity is much smaller than the horizontal current). Comparing dead reckoning based on this velocity with the actual distance made good (from GPS navigation) provides a measure of ocean velocity averaged over the glider's range of depths.
A Brief Operational History
In addition to numerous local engineering operations, Spray has been used in four scientific missions that demonstrate its utility in maintaining a time series at a point (synthetic mooring mode), in sampling along a section, and in forming a cooperative array for sampling a four-dimensional volume.
AOSN1
In August 1999 the first ONR-sponsored Autonomous Ocean Sampling Network (AOSN, www.mbari.org/aosn/default.htm) experiment was mounted in Monterey Bay, California. A Spray with Precision Measurement Engineering (PME) CTD maintained a "synthetic mooring" station in the Monterey Underwater Canyon in order to describe internal waves as they propagate up the Canyon. The chosen site was on the canyon axis where the flat bottom was at 380 m depth and the steep canyon walls were about 3 km apart. An 11-day time series of profiles at approximately 90-minute intervals was obtained showing that the tidal motion was substantially bottom intensified at this site3.
2001 CalCOFI Line 93
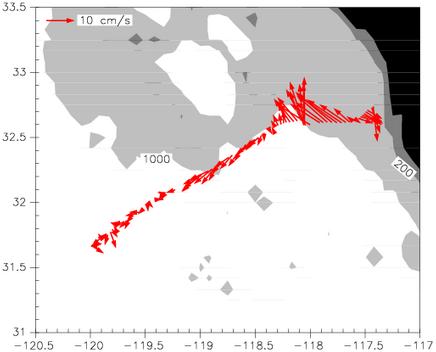 |
Trajectory and current velocity (see scale in upper left) averaged over the upper 500 m from a Spray mission off La Jolla in 2001. |
In September 2001, as part of a NOAA Climate Observation Program development project, a Spray was deployed from a small boat near La Jolla to sample roughly along Line 93 of the CalCOFI survey (CalCOFI has sampled continuously since 1949 and has been maintained at quarterly interval since 1985, www-mlrg.ucsd.edu/calcofi.html). The glider sampled to 500 m depth with a PME CTD. The figure above shows the track and measured current averaged between the surface and 500 m depth. The California Current is evidenced by a subtle equatorward bias in the offshore flow. The figure below shows the associated potential density section. The gradual descent of isopycnals approaching coast is consistent with the
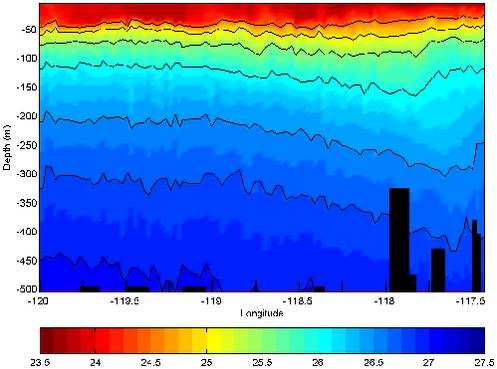 |
Potential density along the section off La Jolla depicted above. |
poleward flow evident about 75 km offshore in the directly measured currents. This is presumably a manifestation of either the California Undercurrent or the inshore branch of the Southern California Bight Eddy, a recurrent retroflection of the California Current. Shortly after the glider was commanded to reverse course it was suddenly, probably from a malfunction of the attitude control system.
Monterey 2003
The second AOSN experiment (www.mbari.org/aosn/AOSN_MB2003table.htm ), which took place throughout August 2003, included a fleet of 10 Slocum Battery gliders and 5 Sprays (funded by ONR and NOAA). The gliders' main objective was to sample an approximately 100-km square ocean region well enough that models assimilating their data could provide dynamically consistent analyses (nowcasts) and forecasts of ocean conditions. The Slocums, with operating depths of 200 m and shorter operational lifetimes, were deployed near shore. The Sprays, with maximum operating depth of 1500 m and many-month durations, were set to sample five, approximately 100-km long, offshore sections to a depth of 400 m (or the bottom where shallower). The Sprays operated continuously for 35 to 42 days without mishap. Early in the experiment, when the usually equatorward upwelling-favorable winds were calm or reversed, the California Undercurrent was flowing strongly to the northwest with depth-average currents peaking over 25 cm/s as shown in the figure below. These strong currents made it difficult for gliders to follow their assigned offshore lines but sampling remained reasonably well spaced. A total of 2075 profiles of T, S and optical backscatter or fluorometer were collected, most to 400 m depth but some to 750 m.
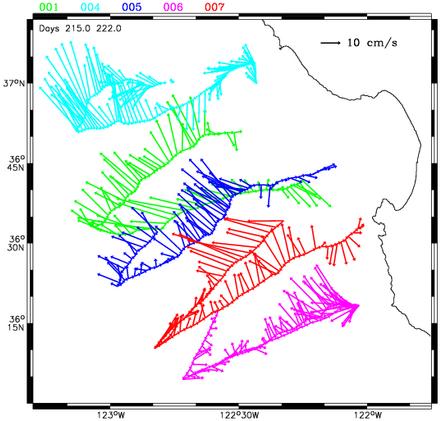 |
Depth-average currents from a 7-day period early in the 2003 AOSN field trial. The strong currents made it difficult for gliders to follow occupy their assigned offshore lines (the 2 southernmost tracks also show the paths by which gliders were deployed from central Monterey Bay). |
The Monterey 2003 operation exposed weaknesses with the sensors employed. Monterey Bay is a highly productive area in which jellyfish, salps, and marine snow are abundant. The optical backscatter and fluorometer sensors showed drift from bio-fouling within two weeks and all five sensors ceased operating after 3-4 weeks as the fouling became severe. The PME CTD showed frequent jumps in conductivity calibration (causing salinity jumps ranging up to 0.03) that did not recover on successive profiles. Nevertheless, this experience caused us to abandon the PME CTD in favor of a Sea Bird CTD with pumped seawater system that is protected from bio fouling by biocides.
The time and space scales observed in Monterey during the AOSN II experiment are depicted below for temperature averaged between 100 and 150 m. Near-surface scales are slightly longer than shown whereas velocity scales are somewhat shorter. These scales are small enough that the 5 gliders tasked to cover the 100-km square were too few to accurately describe the synoptic structure. Moving at 25 km/day a glider provides, at any given moment, a signal-to-noise of unity (correlation of 0.707) over an area of roughly 900 km2 or less. So even discounting loss of coverage when a glider reverses course and over-runs its track and assuming that different coverage areas do not overlap, 5 gliders can map less than half the area at any one time, much less if velocity needs to be measured.
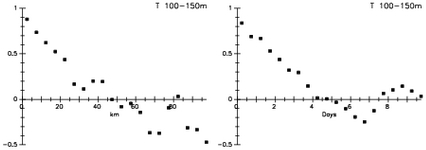 |
Scales of temperature averaged from 100 to 150 m in the Monterey 2003 experiment. Isotropic homogeneous correlation (left) and the time-lagged correlation (right) show scales to be roughly 15 km and 1.5 days. |
Gulf Stream 2004
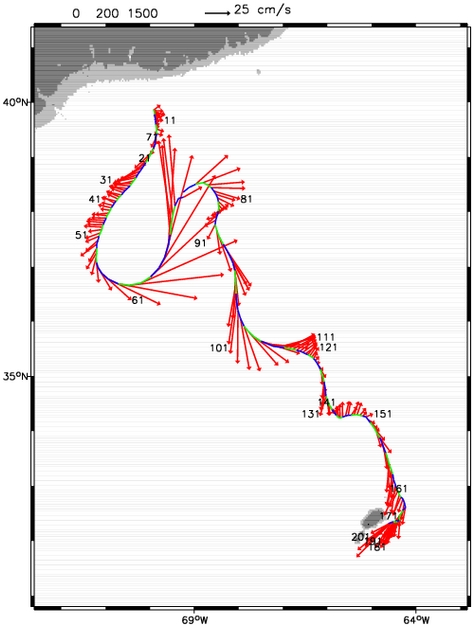 |
Trajectory (blue and green alternating every day) and ocean current vertically averaged from the surface to 1000 m (red, scale at top) for a Spray deployed in September 2004 and in transit to Bermuda. |
In an NSF-funded collaboration with Breck Owens (WHOI), a Spray was deployed in September 2004 over the continental slope south of New England and directed to cross the Gulf Stream and head to Bermuda, a journey of 1000 km. The figure above shows the path the glider took and the measured current averaged between the surface and 1000 m. The glider's path was wildly contorted by the meandering Gulf Stream, which had depth-averaged currents in excess of 100 cm/s. Even while being pushed northward by a meander, was clearly seen in satellite surface temperature, the glider was steered so that it was always crossing the Stream.
Because the glider is always trying to cross the Gulf Stream, regardless of its absolute motion, a section with distance traveled as the horizontal axis shows the general structure of the Stream. The figure below shows such a section in which potential density is shown as line contours on top of optical backscatter (in FTU) contoured in color. We interpret this backscatter as
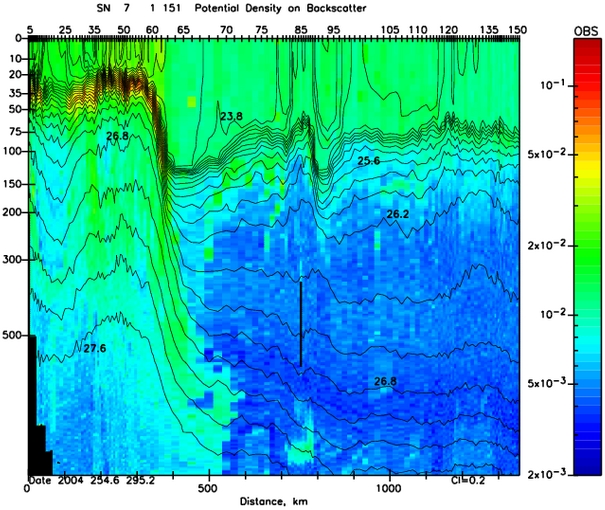 |
primarily biological because of the way it is concentrated in the pycnocline near 30 m depth north of the Stream and the way it drops to low values for density greater than = 25. The long-term goal of this program is to determine if and how gliders can be used to gather time series of the climatically important properties of boundary currents.
How was Spray developed?
The idea for buoyancy-driven winged vehicles belongs to Henry Stommel, the visionary physical oceanographer from Woods Hole that played such an important role in fostering neutrally buoyant floats with John Swallow as well as explaining many aspects of the ocean's dynamics, most notably the way that sphericity of the rotating earth leads to strong currents on the western sides of oceans. Stommel was a neighbor of Doug Webb, who was a co-inventor with Tom Rossby (URI) of the SOFAR float (a massive neutrally buoyant vehicle that could be tracked at long range by acoustic signals it emitted.) Webb had been working on Russ Davis' idea for an autonomous float that used buoyancy change to periodically cycle to the surface for satellite locating and data relay, eliminating the need for an acoustic tracking network. Stommel was quick to see the possibilities of going beyond current following floats and developing a small autonomous underwater vehicle driven by buoyancy change. Indeed he expanded on the idea of buoyancy driving by proposing a way that the work needed to change vehicle volume could be extracted from the temperature gradient in the ocean. His "Slocum Mission" article1 laid out the future with remarkable prescience.
Today's three operational glider are products of the ONR Autonomous Ocean Sampling Network program under the guidance of Dr. Tom Curtin. 'Spray' was developed by a collaboration between WHOI (under Breck Owens), the Instrument Development Group of SIO (under Russ Davis), and, initially, Doug Webb. A University of Washington team assembled by Charlie Eriksen developed 'Seaglider.' Webb eventually developed the 'Slocum Battery' through Webb Research Corporation.
The Instrument Development Group
The Instrument Development Group (IDG) is a recharge facility of the University of California at San Diego. Since establishment in 1972, IDG has played a major role in developing a number of instruments for oceanographic use. The Vector Measuring Current Meter (VMCM) was developed and transitioned to commercial manufacture by the IDG. IDG collaborated with Amatek-Straza in developing the first commercially available shipboard Acoustic Doppler Current Profiler (ADCP) and with RD Instruments to develop the first self-contained ADCP for use on moorings; both these were immediately commercialized. The CODE drifter (Davis, 1985a,b) has been used in large numbers for coastal observations. The Autonomous Lagrangian Circulation Explorer (ALACE) was developed in collaboration with Webb Research Corp. that now provides a modernized float commercially. IDG developed the Profiling ALACE (Davis, et al., 1991) and transitioned that development to a commercial product sold by Webb Research. IDG developed a second-generation autonomous profiling float (Davis, et al. 2001), the Sounding Oceanographic Lagrangian Observer (SOLO), that is a major contributor to the U.S. component of Argo and is manufactured at Woods Hole and in Germany. SOLO has also been used as a platform for long-term observations of vertical mixing (Sherman et al., 1995), vertical motion in convection (Lavender et al., 2002), wave and bubble properties under hurricanes, underwater earthquakes, and Particulate Organic Carbon (Bishop et al., 2002; Bishop et al., 2004) in the upper ocean. Under the guidance of Dan Rudnick (SIO), IDG is now developing an Underway Conductivity, Temperature and Depth instrument that can be deployed and retrieved from ships traveling at 10 to 20 knots.
The key personnel of IDG are:
Russ Davis. Scientific supervisor of IDG. rdavis@ucsd.edu +1(858) 534 4415
James Dufour. Supervisor of IDG. Mechanical and hydraulic systems. Developed the CODE drifter, major redesigns of the ALACE float, mechanical design of SOLO. jdufour@ucsd.edu +1(858) 534 7591
Lloyd Regier. Principal Development Engineer. Supported development of shipboard and moored ADCPs. Software design for ALACE and SOLO. lregier@ucsd.edu +1(858) 534 4607
Brent Jones. Development Engineer. Improvements to Spray and SOLO hydraulic systems. Responsible for data relay and internet operations. b3jones@ucsd.edu +1(858) 822 2973
Jeffrey Sherman. Research Specialist and designer of the SOLO microstructure profiler and 'Spray'. jtsherman@ucsd.edu +1(858) 534 9863
Mailing Address:
University of California, San Diego
Instrument Development Group
9500 Gilman Drive MC-0213
La Jolla, CA 92093 USA
References
- Stommel, H., 1989. The Slocum mission. Oceanography, 2, 22-25.
- Davis, R.E., C.E. Eriksen and C.P. Jones, 2002. Autonomous buoyancy-driven underwater gliders. Pp 37-58 in The Technology and Applications of Autonomous Underwater Vehicles.G. Griffiths, ed, Taylor and Francis, London. 324 pp.
- Sherman, J., R.E. Davis, W.B. Owens and J. Valdes, 2001. The autonomous underwater glider 'Spray.' IEEE Oceanic Eng., 26, 437-446.
- Davis, R.E., 1985a. Drifter observations of coastal surface currents during CODE: The method and descriptive view. J. Geophys. Res., 90, 4741-4755.
- Davis, R.E., 1985b. Drifter observations of coastal surface currents during CODE: The statistical and dynamical views. J. Geophys. Res., 90, 4756-4772.
- Davis, R.E., D.C. Webb, L.A. Regier and J. Dufour, 1991. The Autonomous Lagrangian Circulation Explorer (ALACE). J. Atm. Oceanic Tech., 9, 264-285.
- Davis, R.E., J.T. Sherman and J. Dufour, 2001. Profiling ALACEs and other advances in autonomous subsurface floats. J. Atm. Oceanic Tech., 18, 982-993.
- Sherman, J.T., and R.E. Davis, 1995. Observations of Temperature Microstructure in NATRE. J. Phys. Oceanogr., 25, 1913-1929.
- Lavender, K.L., R.E. Davis and W.B. Owens, 2002. Observations of open-ocean deep convection in the Labrador Sea from subsurface floats. J. Phys. Oceanogr., 32, 511-526.
- Bishop, J.K.B., R.E. Davis and J.T. Sherman, 2002. Robotic observations of dust storm enhancement of carbon biomass in the North Pacific. Science, 298, 817-821.
- Bishop, J.K.B., T.J. Wood, R.E. Davis and J.T. Sherman, 2004. Robotic observations of enhanced carbon biomass and export at 55oS during SOFEX. Science, 304, 417-420.